

Despite multiple predictions of a Bitcoin (BTC) surge in October, history may be repeating itself as BTC could face a sharp drop toward $60,000 first.
Bitcoin (BTC), currently at $109,464, has fallen over 12.75% from its all-time high of $124,500, leaving traders divided.
Some view this as a standard bull market correction, while others caution that a new bear cycle may be underway. The key question remains: which side of the debate holds the stronger case?
Bitcoin 2021 chart fractals hint at $60,000
According to several crypto market analyses, Bitcoin (BTC) may follow a price pattern similar to the one that preceded the 2021 market peak.
Crypto analyst Reflection highlights that in 2021, BTC surged to all-time highs, formed a blow-off top, corrected down to mid-range support, and then failed to reclaim resistance.
This sequence triggered a crash of over 50%, sending Bitcoin from nearly $69,000 to around $32,000 within just a few weeks.
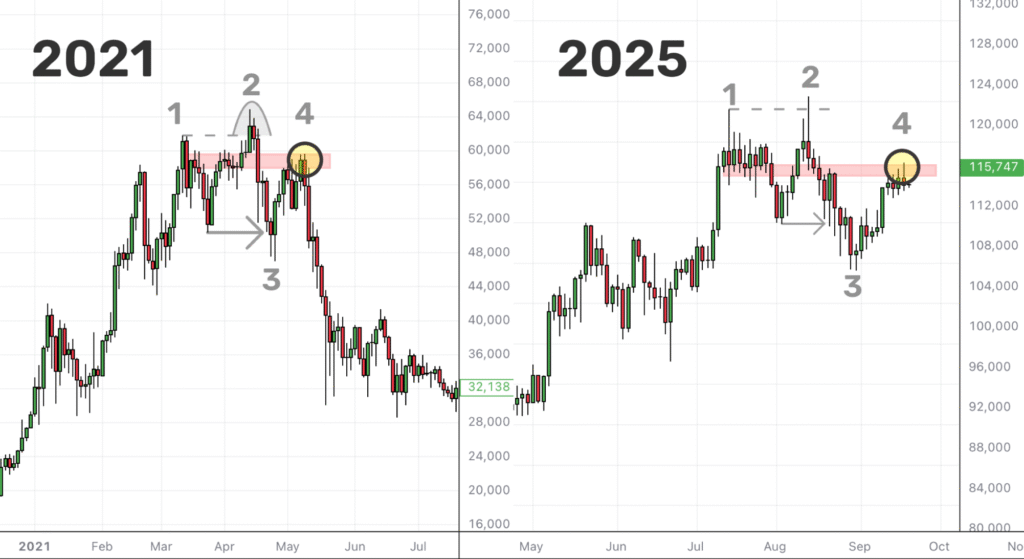
Bitcoin (BTC) in 2025 appears to be following a similar four-step pattern seen during the 2021 market peak, hovering just below a distribution zone that previously signaled a bearish reversal.
If this fractal pattern persists, BTC could face a comparable price rejection.
Read more: Crypto on Golf Courses – From Gaming and Sponsorships to Luxury Purchases
On the weekly chart, Bitcoin has also broken below a rising wedge, a bearish formation defined by higher highs and higher lows within narrowing trendlines, suggesting potential further downside.
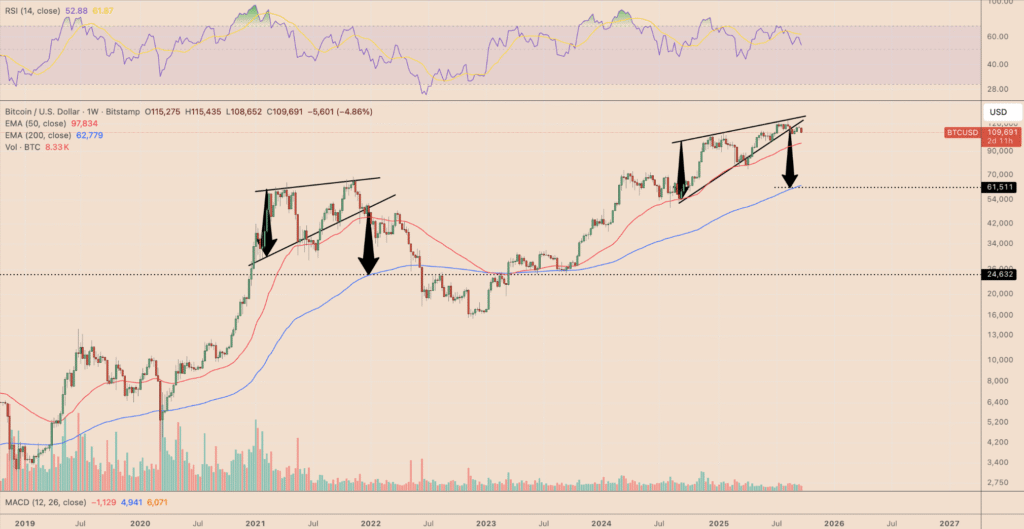
The breakdown increases the risk of Bitcoin (BTC) sliding toward the $60,000–$62,000 zone, which aligns with the 200-week exponential moving average (200-week EMA). Some analysts even foresee BTC potentially dropping as low as $50,000.
Importantly, a comparable rising wedge breakdown in 2021 led to a 55% correction, bringing Bitcoin down to the same 200-week EMA support.
Bitcoin may recover to over $124,500
Not all analysts expect a prolonged Bitcoin (BTC) downturn.
Trader Jesse points out a support cluster formed by BTC’s 200-day simple and exponential moving averages, noting that the cryptocurrency could establish a “mid-term bottom” at this level during typical bull market corrections.
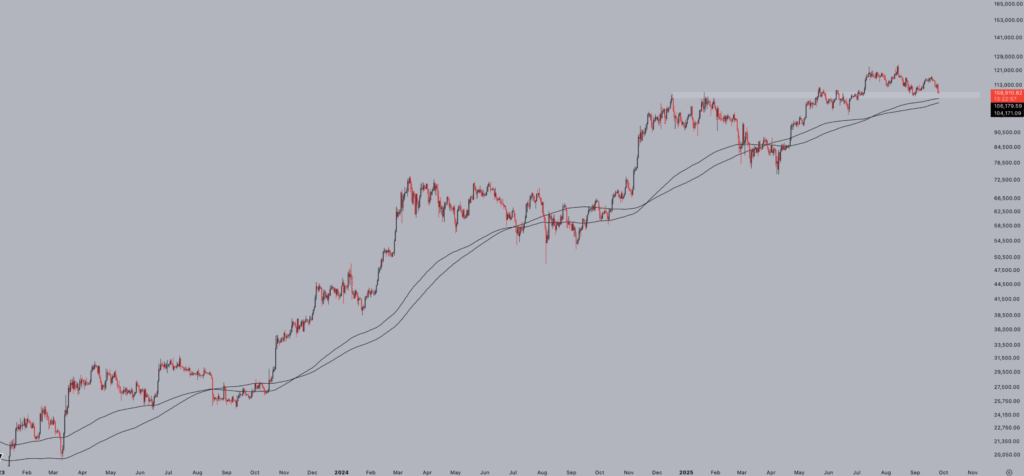
As of Friday, Bitcoin’s (BTC) 200-day EMA support was hovering around the $104,000–$106,000 range.
Analyst Bitbull notes that Bitcoin (BTC) remains far from a true market cycle top, highlighting that the US Business Cycle, a key measure of economic momentum, has yet to peak—an event that typically precedes major market downturns.
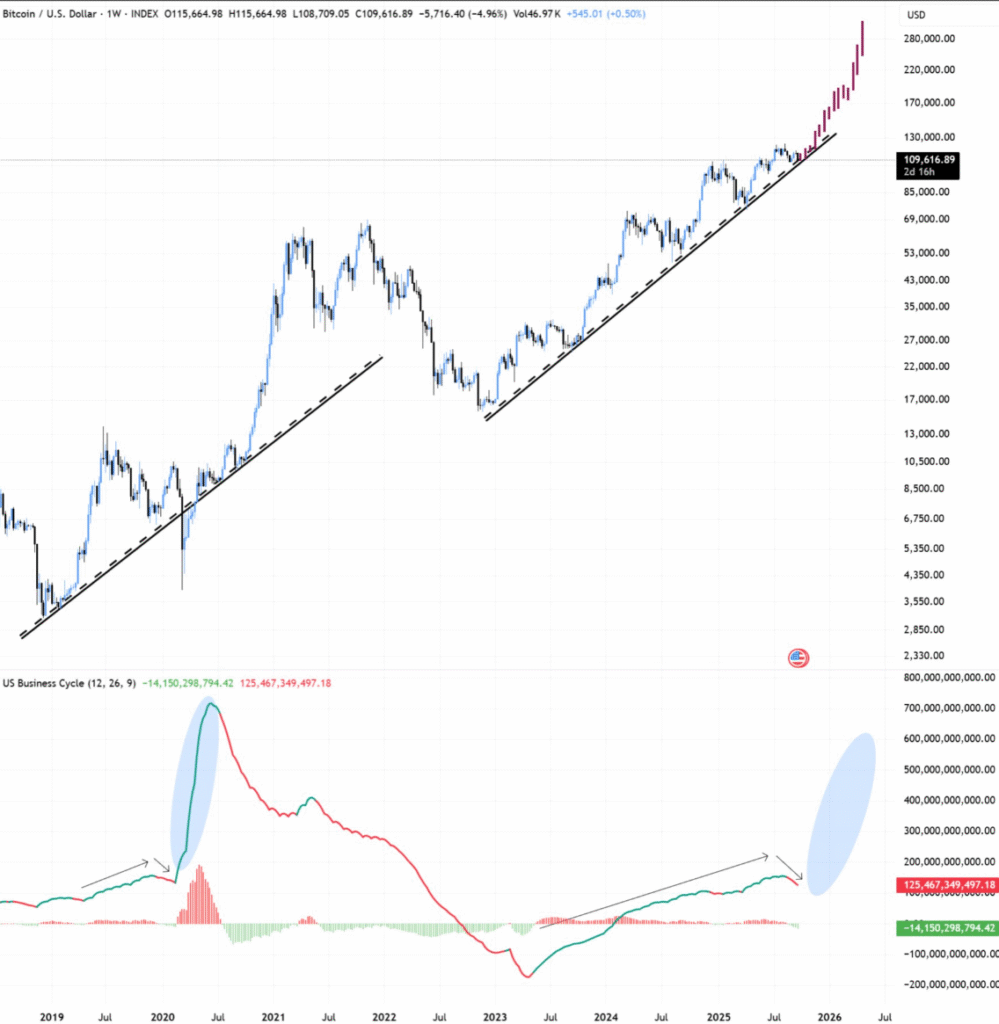
With the Federal Reserve cutting interest rates, analyst Bitbull suggests that Bitcoin (BTC) could enjoy another three to four months of upside before hitting a potential “blow-off top.”
Bullish signals reinforce the possibility of BTC climbing as high as $140,000, according to analyst Captain Faibik. He views the current dip as a “healthy correction,” with Bitcoin retesting its 200-day moving average near $104,000 as a potential support level.
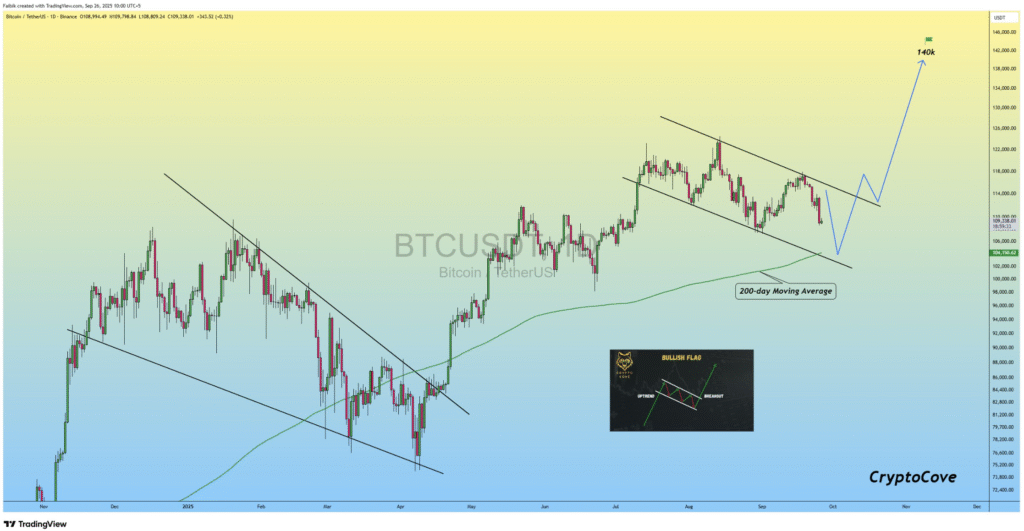
Analyst Captain Faibik highlights the formation of a potential bull flag for Bitcoin (BTC). A decisive break above the $113,000 resistance zone could confirm the pattern, paving the way for a rally toward $140,000 in the coming months.
Several analysts have projected similar year-end targets for BTC, with some even anticipating macro tops in the $150,000–$200,000 range.
Conclusion
The future of Bitcoin (BTC) remains highly debated, with analysts divided between a potential drop to the $60,000–$62,000 zone and a bullish surge toward $140,000. Historical patterns, technical indicators like the 200-week and 200-day EMAs, and macroeconomic factors such as the US Business Cycle and Federal Reserve interest rate cuts all play crucial roles in shaping BTC’s price trajectory.
FAQ’s
What is the current Bitcoin (BTC) price prediction?
Analysts are divided, with some forecasting a drop to the $60,000–$62,000 zone, while others predict a bullish surge toward $140,000.
What factors influence Bitcoin’s price movement?
Historical patterns, technical indicators like the 200-week and 200-day EMAs, and macroeconomic factors such as the US Business Cycle and Federal Reserve interest rate decisions all impact BTC’s trajectory.
How does the 200-week EMA affect Bitcoin’s price?
The 200-week EMA acts as a long-term support level, often preventing significant declines and signaling potential trend reversals.
What role does the 200-day EMA play in BTC analysis?
The 200-day EMA provides insight into medium-term trends, helping traders identify healthy corrections or potential support during market dips.
Could Bitcoin drop to $60,000?
Yes, some analysts warn that BTC could revisit the $60,000–$62,000 zone, especially if bearish technical patterns repeat.
Is a surge to $140,000 possible for BTC?
A bullish scenario remains possible if key resistance levels are broken and macroeconomic conditions support further upside.
How do macroeconomic factors influence BTC?
Interest rate cuts, US economic cycles, and inflation trends can affect investor sentiment, directly impacting Bitcoin’s price.